James Wickham: Two charts that tell very different stories about inequality in Ireland today…
Both charts show the Gini coefficient of income distribution: the lower the Gini coefficient the more equal the society. The first (Figure 1a) shows Ireland as the most unequal society within the EU: the Gini is higher than for any other member state.
Figure 1a Gini, market incomes 2013
By contrast, in the second (Figure 1b) shows Ireland to be boringly normal: Ireland's Gini is in the middle of the range.

 |
| Figure 1b Gini, disposable incomes 2013 |
If you want to portray Ireland as some sort of unequal disaster zone, you take Figure 1a. Yet what matters to most people is how much income they have after deduction of direct taxes, and conversely also after receipt of state benefits and pensions. Figure 1b thus is closer to the everyday experience of inequality.
Comparing the two charts in Figure 1 shows the impact of the taxation system (or at least of direct taxation) and of the benefit system on income. In other words, the comparison begins to show the impact of the state on inequality. Nearly everywhere the welfare state reduces inequality, but usually to the same extent. Thus most countries are in more or less the same position in both the two charts, but Ireland is one of the few exceptions. In Ireland the welfare state and the system of direct taxation reduce income inequality to a much greater extent than in most other countries.
Of course there are lots of qualifications to this argument. As TASC’s recent inequality report stressed, simply comparing disposable income ignores the extent to which people may have to pay for services in one country where they are cheaper or even free in other countries. For example, Ireland has long been notorious for the high cost of and limited provision of childcare (though after the new budget this may change); Ireland now has very limited provision of social housing. Furthermore, changes in prices may differentially affect different income groups. For example, recent rises in housing costs (mortgage interest payments and rent) have affected all income groups, but the poorest have been especially hard hit (Savage et al 2015). However, there is no reason why this should always be the case – falls in the price of basic goods such as food will usually disproportionately benefit the poorest groups! Finally it is important to be remember that measurements of inequality are by themselves simply measures of relative difference: they say nothing about actual deprivation and actual living standards. Indeed for all the real recovery of the last few years, TASC’s Inequality Report rightly stresses that the level of material deprivation in Ireland is still rising (Hearne and McMahon 2016: 43).
Two other aspects of state income and expenditure are important.
First, it is perfectly possible for a taxation and benefit system to actually exacerbate inequality. Figure 2 shows how in Poland between 2007 and 2010 inequality of market incomes was reduced, but this fall was much less for disposable income. Consistent with this, Figure 1a shows Poland in 2013 as having a relatively equal distribution of gross earnings, but when actual disposable incomes are used as in Figure 1b Poland moves significantly to the more unequal end of the spectrum.
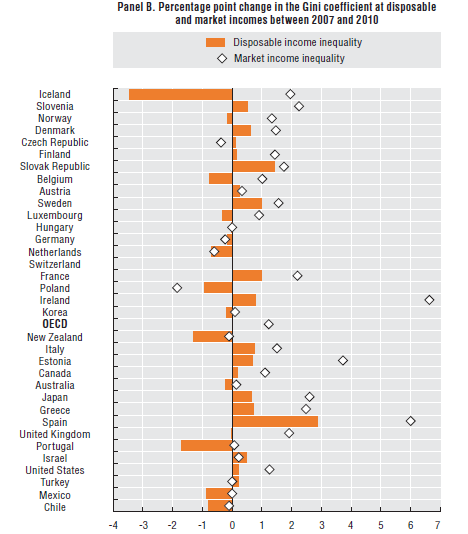 |
| Figure 2 Change in Gini for disposable and market incomes 2007-2010 Source: OECD (2014: 111) |
Second, the state does a lot more than redistribute income. In developed welfare states most people pay tax, but everybody is directly and indirectly the beneficiary of state expenditure. The welfare state is operates more as an intergenerational contract (see especially Hills 2015) than as a redistribution between income groups. Indeed, some state-funded activities and many state investments are disproportionately used by the better-off (this is the populist argument for means-testing). A state-funded education system will always tend to be more used by the ‘strong elbows of the middle class’; relatively affluent commuters are beneficiaries of subsidised public transport (think the Luas Green Line). Extreme cases would be where the state plays a key role in the maintaining the national culture and civil society: higher education, art and culture. Although in European terms Ireland is an affluent society, not only are our levels of infrastructure investment low but we also spend relatively little on higher education and on the arts. In all of this we are course closer to Boston than Berlin.
Ireland is also a low taxation society - as TASC has repeatedly documented the share of taxation is lower than in most EU states especially in the more developed welfare states. Very simplistically this would seem to suggest that whereas in a country like Denmark the state has enough revenue to redistribute income, and provide services and invest in physical and social infrastructure, in Ireland it can only effectively do the first. Whether this actually is the case would be a useful subject for research and discussion.
References:
European Commission (2014) Employment and Social Developments 2013. Luxembourg: Publications Office of the European Union.
Hearne, Rory and Cian McMahon (2016) Cherishing All Equally 2016: Economic inequality in Ireland. Dublin: TASC
Hills, John (2015) Good Times, Bad Times: The welfare myth of them and us. Bristol: Policy Press.
OECD (2014) Society at a Glance: OECD Social Indicators. OECD Publishing.
Savage, M. et al (2015). The Great Recession, Austerity and Inequality: Evidence from Ireland. ESRI Working Paper No. 499 (April 2015).
Wickham, James (2015) Irish Paradoxes: The bursting of the bubbles and the curious survival of social cohesion. Steffen Lehndorff (ed.), Divisive Integration: The triumph of failed ideas in Europe – revisited. Brussels: ETUI, pp. 127-147.
Professor James Wickham

James Wickham was Jean Monnet Professor of European Labour Market Studies and Professor in Sociology at Trinity College Dublin. He has published widely on employment, transport and migration in Ireland and Europe; he is the author of Gridlock: Dublin’s Transport Crisis and the Future of the City and co-author of New Mobilities in Europe: Polish Migration to Ireland post-2004. His book Unequal Europe: Social divisions and social cohesion in an old continent analysed the collapse of the European Social Model; his new text book European Societies (Routledge 2020) examines the structures of inequality in contemporary Europe. He is a former director of TASC.
Share:


![Duggan, Vic]](/assets/img/2017/04/1491994913319631_sq.jpg)