Latest CSO figures...
On February 1st the CSO released the latest Irish results of the EU-SILC (European Union Survey on Income and Living Conditions). It’s important to notice that these figures are for the year 2015 so they don’t necessarily describe the situation today in February 2017. If the trends identified in these figures in 2015 have continued, the situation today should be even better.
Things are getting better?
Overall these figures show some welcome improvements: employment of course has been rising, but also for nearly everyone income has risen and for most people deprivation rates have fallen. Crucially there has been a small but significant reduction in income inequality.
Do these results challenge the claim that inequality and deprivation continue within the recovery? In terms of the Gini coefficient as a simple measure of inequality, certainly inequality has fallen somewhat: in 2015 the Gini coefficient for annual equivalised income was 30.8, down from 32.0 the year before (Chart 1).
Chart 1
But there is an enormous caveat. These figures refer to the amount of disposable income that people have. They say nothing about what people spend this money on. If essential services (childcare, health, education, public transport) are effective and free, then the society will be more equal than in a society with a similar level of inequality in disposable income. Furthermore, it may be the case that specific price increases (or increased taxes or charges) effect those on low incomes most. In Ireland this seems to have happened with housing costs increasing – but most for those in the lower income groups. Nonetheless it is certainly possible that there has been some small reduction in income inequality.
Measuring poverty
A crucial aspect of inequality is the extent of poverty. This gets us closer to people’s actual experience. The simplest measure of poverty is the so-called ‘at risk of poverty rate’, that is to say those people whose income is less than 60% of the median. That hardly means that the poor are always with us. It’s perfectly possible for nobody to have an income less than 60% of the median. Indeed in these terms some societies with broadly similar GDP to Ireland do better than us – and many do worse (Chart 2). Unsurprisingly, the at risk of poverty rate is lower in Denmark and Sweden than in Ireland. Equally unsurprisingly, the rate is dramatically higher in Greece. According to the latest CSO figures, the proportion of those at risk of poverty in Ireland stood at 16.9% of the population in 2015 – a non-significant fall compared to 2014.
Chart 2
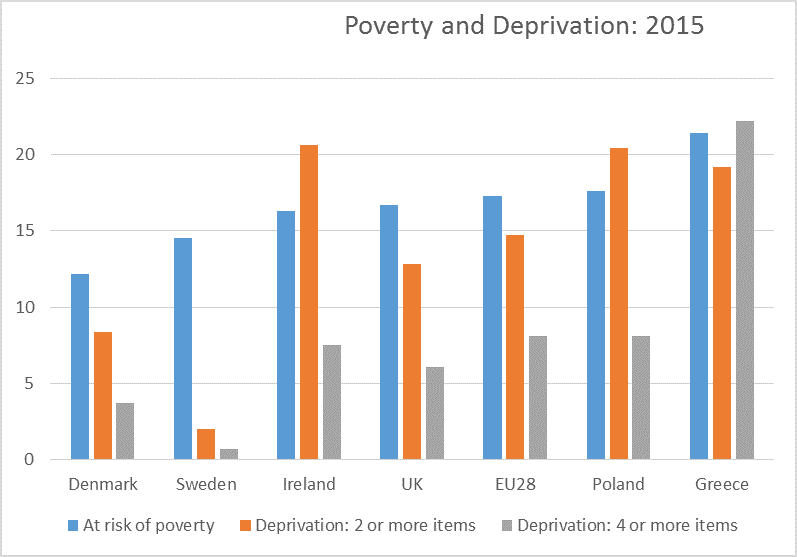
Source: Eurostat [from EU-SILC]
Measures of material deprivation get us closest to the real experience of inequality. The CSO defines the deprivation rate as the proportion of the population unable to afford two or more items from a list of eleven basic requirements (e.g. heating the house, a warm waterproof coat…). This deprivation rate did fall from 2014 to 2015 but was then still 25.5% of the population. The deprivation rate is significantly higher in households with children. As Chart 2 shows, in Ireland the deprivation rate is significantly higher than in Scandinavia and indeed marginally higher even than Greece. However, if we focus on extreme deprivation, the lack of four or more items, then Ireland appears more like a normal European country and now very different to Greece (and indeed most of the New Member States).
A final statistical measure is that of ‘consistent poverty’, that is to say, the proportion of the population who both have an income below 60% of the median and live in a household without two or more of the list of basic necessities. The new data shows the rate of consistent poverty staying essentially unchanged between 2014 and 2015 (it fell from 8.8% to 8.7% but this is not statistically significant). As we have seen, overall deprivation rates have fallen, but worryingly for those in consistent poverty they have hardly changed at all. In many ways therefore, those most at risk of poverty have actually been falling behind.
Comparing what matters
All of this depends on looking at net income – income after tax and social benefits. Every now and then you will hear people claiming that Ireland is the ‘most unequal society in Europe’ because of the inequality of gross incomes (i.e. before tax and transfers). Yet what matters for people’s living standards is not their gross pay, but how much money they actually have to spend – after tax and after any benefits. To focus on gross income inequality while ignoring tax and benefits is like saying that Ireland’s summer is sunnier than Spain’s. Well, if you just count the hours of daylight that’s true, but there is the little matter of clouds and rain…
Chart 3
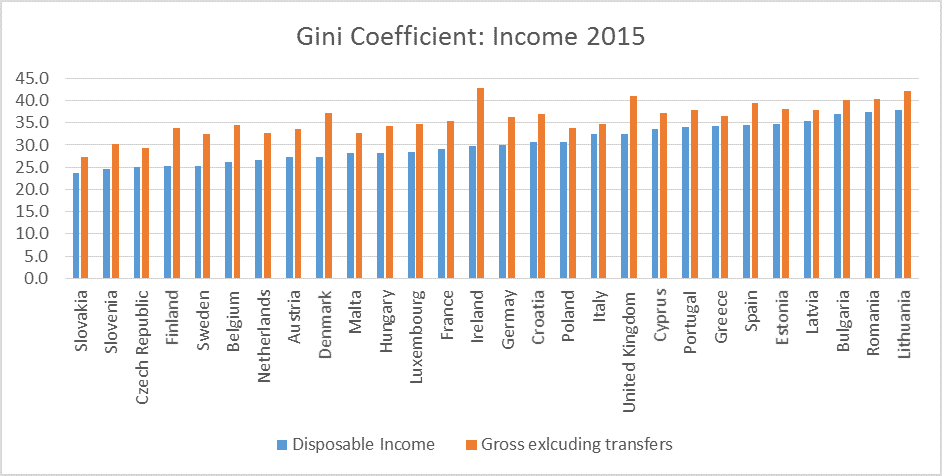
Source: Eurostat
In these terms the problem in Ireland is not that compared to other European countries we are uniquely unequal. Chart 3 shows the Gini coefficients for all EU28 member states and ranks them from left to right in terms of inequality of disposable income: states range from Slovakia, in these terms the most equal, to Lithuania, the most unequal. Ireland is roughly in the middle. Just a normal European country you might say. However the right hand column shows the inequality of gross income, excluding transfers, and here Ireland is clearly the most unequal. Furthermore, we have the largest gap between gross income and disposable income.
In Ireland the state has to work extraordinarily hard even to ensure our ‘normal’ level of inequality. So much state expenditure has to go on income support that there is little left over for services and capital investment. And in turn, the resulting deficiencies in education, childcare and health mean that as soon as they can afford it (and even if they can’t), people opt for private provision. Rather less obviously, there is the question of state competence. In some areas the Irish state is efficient and effective, but it clearly lacks the competences skills and institutional knowledge to organise effective healthcare and social services and is notoriously incompetent in physical planning and infrastructure.
Professor James Wickham

James Wickham was Jean Monnet Professor of European Labour Market Studies and Professor in Sociology at Trinity College Dublin. He has published widely on employment, transport and migration in Ireland and Europe; he is the author of Gridlock: Dublin’s Transport Crisis and the Future of the City and co-author of New Mobilities in Europe: Polish Migration to Ireland post-2004. His book Unequal Europe: Social divisions and social cohesion in an old continent analysed the collapse of the European Social Model; his new text book European Societies (Routledge 2020) examines the structures of inequality in contemporary Europe. He is a former director of TASC.
Share:


![Duggan, Vic]](/assets/img/2017/04/1491994913319631_sq.jpg)