A previous blog looked at the broad contours of inequality in Ireland today. What we found was that (i) inequality has grown here (ii) Ireland now ranks in the middle among European countries as other countries have become much more unequal and (iii) Ireland has unusually high levels of market inequality. Here we probe the matter further by looking at which groups drive inequality, here and elsewhere.
There are, of course, many ways to measure inequality. Palma shows that gains and losses in national income are driven by gains and losses of the top ten percent at the expense of the bottom 40 percent. The share of income that accrues to the middle - the group of earners below the top decile and above the bottom four - is remarkably stable across heterogeneous groups of countries. In order to understand changes in inequality then, it is best to focus on these two groups, and less on the middle group.
The figure below shows that this is certainly the case for the EU-28. It shows the share of equivalised national income accruing to the top ten percent, the bottom 40 percent and the group between. Countries are arranged according to the share of income gained by the bottom. In the leftmost country, Bulgaria, the bottom 40 percent receives about 17% of national income, the top ten percent receives about 28% and the group below the top ten percent and above the bottom 40 percent receives about 55%. Strikingly, there is remarkably little variation in the share of income going to the middle-income group. In the rightmost country, the Czech Republic, it secures 54% of national income, almost the same as in Bulgaria.
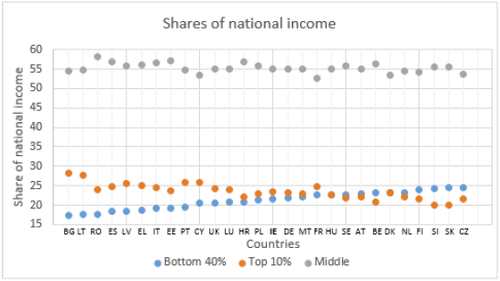
Source: The state we are in.
Ireland ranks right in the middle. The bottom 40 percent receives about 22% of national income, while the top ten percent receives almost a quarter. As elsewhere the middle groups receives about 55% of national income. It is apparent that to understand the dynamics of income inequality in Ireland, it is best to focus on high and lower earners.
The next figure shows the income shares of the four deciles that comprise the bottom 40% of earners. The first decile denotes the bottom tenth of income earners. The fourth decile comprises the fourth poorest tenth, and so on. The Top 5 denotes the average of the five most equal countries in the EU according to the share of income that the bottom 40 collectively receives.
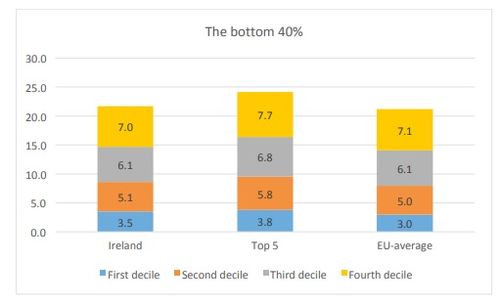
Source: The state we are in.
In Ireland, the first decile or bottom ten percent receives 3.5% of national income, the next deciles receive 5.1%, the 6.1%, and then 7.0% respectively. Though Ireland is in the middle among the EU, the bottom 40 percent receives above the EU-average because the most unequal countries (such as Bulgaria) are particularly unequal. What sets Ireland apart from the EU-average is that the bottom ten percent does relatively well. Comparing Ireland to the most equal countries, again we see that the poorest do only slightly worse. Where Ireland fares less well is in how much income the groups above the first decile receive. We see that the second, third, and fourth deciles receive significantly less in Ireland than in the most equal countries. As such, it is less the poorest segments of society that are the exception – for they do poorly everywhere – but rather it is the working-to-lower-middle classes that struggle relatively more in Ireland. Given that those in the fourth decile are likely to be employed, or dependent on an employed person, this suggests the problem is one of insufficient pay. That the bottom tenth do comparatively ok is testament to the important role the welfare states plays in reducing income poverty and inequality. Of course, Ireland’s position in the middle in income inequality likely falls when measured using the more relevant but difficult-to-measure consumption inequality. For instance, healthcare is more likely to be free at the point of use elsewhere.
Turning to the top ten percent, the figure below shows the shares of income accruing to the top one percent and the remaining nine that comprise the richest decile of earners. The Top 5 now denotes the most equal countries measured by the share of income going to the top ten percent. Ireland is similar to EU averages except that the top one percent receives somewhat more and the remainder of the top ten percent receives somewhat less. Both the top one percent and the remainder receive significantly more in Ireland than in the five most equal EU countries.
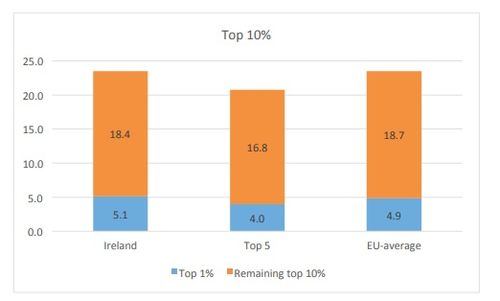
Source: The state we are in.
It is worth comparing these figures to those collected by other agencies. Because of their voluntary nature surveys such as EU-SILC understate the incomes of those at the top in particular. Mandatory tax authority figures, though still not perfect, provide a better gauge of income inequality. According to the Irish Revenue, the top one percent of earners (tax cases) account for 11.3% of income in Ireland. Therefore, the share of income accruing to top earners may be almost double what EU-SILC suggests. Inclusion of incomes transferred offshore or otherwise shielded from the tax authorities would produce higher inequality still.
Thus, the poorest elements of Irish society are less poorly off than in many other EU countries. Where Ireland lags behind compared to the more equal countries is in the share of income that accrues to the bottom 40 percent excluding the poorest ten. Correspondingly, the top ten percent does well here, with the top one percent doing particularly nicely.
Robert Sweeney @sweeneyr82

Robert Sweeney is a policy analyst at TASC and focuses on issues surrounding Irish political economy and distribution. He has a PhD in economics from University of Leeds, which concentrated on financial markets and investors, banking, international macroeconomics, and housing. He is also interested in debates on alternative schools and methodology in economics, and ownership.
Share:

