With continuing housing crises, health crises, inadequate childcare, climate change inaction, there’s no shortage of public policy emergencies going into the New Year. They are all, to varying degrees, related to inequality, and how economic inequality translates into unequal political power. TASC has just released a report on income distribution, which precedes the more comprehensive Cherishing All Equally report to be released in late February. This note is the first in a series of blogs that looks at the nature of inequality in Ireland. Part 1 looks at the broad contours of income inequality and change over time.
So what is the nature of inequality on these shores, and how does Ireland compare with other EU countries? The most widely-used measure of inequality is the Gini coefficient of equivalised disposable income. The Gini coefficient measures how far away we are from perfect equality – 0 meaning everyone earns the same income and 1 meaning one person earns all the income. Disposable income means income after taxes and transfers are paid. This can be compared to market income, essentially income from work and capital income, but before taxes and transfers. It can also be compared to gross income inequality, which is pre-tax income, essentially market income plus social welfare transfers. Finally, equivalised means household income per person is adjusted slightly to account for household composition. So two people living together and sharing costs with a combined income of €50,000 are deemed to have a higher income than the same two people living separately with incomes of €25,000 each.
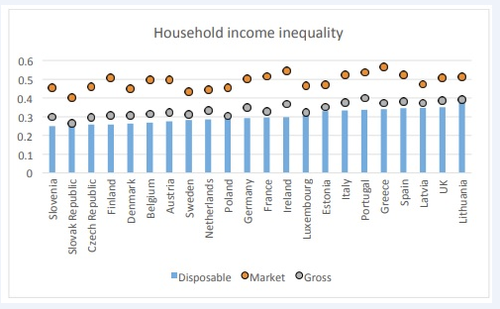
Source: OECD
As such, the figure above shows the Gini coefficient of equivalised disposable, but also market and gross income inequality among EU countries for which data were available. Countries are arranged according to increasing disposable income inequality. Slovenia is the least unequal and Lithuania is the most. Ireland appears to be slightly toward the more unequal end, but this is more an artefact of highly unequal countries such as Romania and Bulgaria being missing – Ireland is, in fact, bang in the middle among EU countries.
Interestingly, we see that except for Greece Ireland has the highest market inequality. Greece’s position as the most market unequal country is really only due to the fact that a quarter of its workforce were unemployed in 2015, the reference year for the data. The more people earning no income in the market, the higher market income inequality will be. In that sense, the low labour force participation rate in Ireland helps explain Ireland’s high inequality, but as we will see in a later blog, this is not the driving force.
Another point that sticks out is the large gap between market and gross (i.e. post-transfer/pre-tax) inequality. This shows that transfers by the state are very important in reducing inequalities generated through the market. The gap between gross and disposable income inequality shows that taxes play an important role in reducing inequality here, but are not as important as transfers.
Framing Ireland’s inequality as average or middling is technically true but misses some important facts. For one, Ireland has historically been a high inequality country. As a recent ESRI paper points out, it only because other countries have grown much more unequal while inequality has been stable here that we now rank in the middle. The ESRI notes 1986 as a turning point in social policy as payments to lower income groups were increased.
Moreover, market incomes have grown more unequal since the late 1970s. This is according to Picketty and co-authors’ World Top Incomes database (with Irish data compiled by Brian Nolan). Though the compilation and measurement of market income is different to the above figure, the trend of increasing concentration of pre-tax and pre-transfer income is clear. The top 1% and 10% earned 4.8% and 23% of Ireland’s income in 1977, 5.2% and 26.1% in 1986, and 11.5% and 37.2% in 2015. Thus, market inequality grew up to the turning point in welfare policy in 1986, so it is likely that disposable income inequality has grown over 40 years, if not the last 30. Given the greater dispersion in market incomes, the apparent stability since the 80s can only have been due to the state making a greater ‘fiscal effort’ to reduce inequality. That is, greater concentration of income at the top necessitates more transfers and taxes to maintain distributional stability.
Finally, I say ‘apparent stability’ in inequality because the figure above is based on the EU Survey of Income and Living Conditions (EU-SILC). Similarly the ESRI finding of no change in disposable income inequality is based on the Irish version, SILC, and its predecessors. Voluntary surveys are, however, notoriously unreliable at measuring incomes of those at the top, and seem to underestimate increases in inequality over time. This, of course, applies to other countries and may not affect Ireland’s relative standing, but it’s likely the case that inequality has increased here in more recent years. As above market inequalities have increased, while at the same time the number of higher tax bands has fallen.
In sum, Ireland’s current status as having medium levels of inequality flatters it. Ireland’s traditionally high inequality has very likely increased over an extended period. The state has had to exert a greater and greater effort to achieve apparent stability, and it seems likely that national income shares at the top have increased more recently as well.
Robert Sweeney @sweeneyr82

Robert Sweeney is a policy analyst at TASC and focuses on issues surrounding Irish political economy and distribution. He has a PhD in economics from University of Leeds, which concentrated on financial markets and investors, banking, international macroeconomics, and housing. He is also interested in debates on alternative schools and methodology in economics, and ownership.
Share:


