Paul Sweeney: There has been no study of the distribution of wealth in Ireland by any government body until recently. Now the CSO has undertaken such a study which examines net and gross wealth and its distribution. It can be found here
There was substantial wealth destruction in the Crash of 2008, and this impacts on current levels of wealth today and will do so for some time because the debts incurred by some subtracts from overall net wealth.
This perhaps is the most interesting lesson from the CSO study. It is that had we not had the seven bubble years from 2001 to the crash in 2008, Ireland and a lot of our people would be a lot better off. This is best illustrated by negative equity, the person in a home for which they paid a great deal more than its present value. The debts built up in that period greatly reduced the net assets accumulated in the good years.
71% of all households own their own home, 11% own land and 14% own other property. The proportion of households who have at least one type of real asset is 95.3%. Of those who have homes, only one-third have mortgages and the median value of these is €129,000. In short, two-thirds of household who own their own homes, own them outright.
The median value (half way between top and bottom) of the home is €150,000. On the other hand farmers’ land has a median value of €350,000. The median value of all real assets is €165,000 per household. This for those who do own any real asset, for some households do not own homes.
Homes and other housing assets make up just over half (52.8%) of the total value of all assets while land is 21% and other property 15%. Cars, trucks, and bikes only account for 3% and valuables make up only 1.9% of the value of all real assets.
Figure 1 below shows the form that wealth is held in in real assets in Ireland. The home is the big one!
Land is next biggest and, as stated, is owned by only 11% of households. Self-employed business assets is 6% of the total.

The most common form of financial asset is savings, i.e. deposit or savings accounts and 90% of households have such accounts, but the median value of these is only €4,500.
Savings make up more than half (55%) of all financial assets with voluntary pensions next highest at 22%.
57% of all households have some form of debt, with the mortgage on their main residence being the main form - at 34% of all households. As we saw above, two thirds of home owners have no mortgages.
The difference between a household’s assets and its debts gives us net assets or net wealth. Median net assets are €105,000 per household, slightly below the Euro area median of €109,000.
While income in Ireland is a little less equal than in the Euro area, the distribution of wealth or net assets here is similar to there.
In a Central Bank study of the CSO data, Lawless and others found that “whereas the top 20 per cent of households account for half of gross income in Ireland, the top 20 per cent of households account for around 70 per cent of net assets.” They found that those at the top are distinguished by two attributes. First they own a lot of wealth and secondly and importantly, they have little debt. The latter point was made earlier in this blog.
They said that “the Gini coefficient for net worth in Ireland is in the middle of the Euro area group of countries.” In general in the Euro area, wealth is distributed more unequally than income.
Interestingly, older people are much wealthier as this chart illustrates.
“Figure 6.3 shows a gradually increasing relationship between net assets and age from the 18 to 34 year old cohort up to the 64 to 74 age cohort, with this then reducing somewhat for the oldest group (over 75 years). The combined effects on net assets of a build-up of real assets and paying down of debt over time are clear from this chart.”
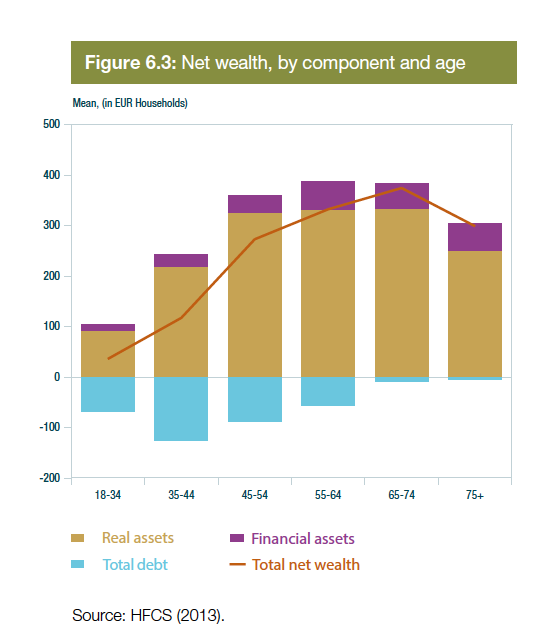
The study shows three very interesting points. First it shows how important property is as the major form of wealth in Ireland. Secondly the study shows how important debt is too, for it is at extraordinarily high levels today. The net position of the 35-44 years olds is greatly reduced by high debt. The third factor is the uneven distribution of wealth between social classes (not shown) and also between age cohorts. Older people have had more time to build up wealth and those with higher incomes can accumulate wealth and pay down debt faster than those with low incomes.
The Celtic Tiger years gave us a great opportunity to build up real wealth in Ireland, for that period form 1987 to 2001 was based on remarkable employment, wage and productivity growth. Had the economic policies of de-regulation (Red Tape), tax shifting from direct to indirect taxes (reducing the “Burden” of progressive taxes on work to reward high paid entrepreneurs/speculators) and so on not been pursued, Ireland would be far richer today.
But we all now know that.
The CSO study of almost 11,000 households (not individuals) had a very good response rate of 52%. Of course the really rich do not respond well to such surveys and so they are likely to be under-represented.
In short, the store of wealth in the hands of the seriously rich is likely to be understated. There is a way around this. That is for the Revenue to periodically demand a return of the gross and net assets of all taxpayers. Unlike the CSO survey this will be of actual wealth (and debts too).
This would give economists and policymakers a much better understanding of the actual economy – for we (rather the Revenue) would then know who owns what where and with accurate aggregate data, policymakers could plan accordingly. This idea of a wealth /asset assessment by each tax authority in EU will be suggested as a policy proposal for each of the 28 member states by the European Trade Unions to the Commission shortly.
There is much more information in the CSO study and indeed more information will be revealed later in the year from the study. It was a long time coming and adds substantially to our understanding of our economy and society.
Paul Sweeney is Chair of TASC's Economists' Network
Paul Sweeney @paulsweeneyman

Paul Sweeney is former Chief Economist of the Irish Congress of Trade Unions. He was a President of the Statistical and Social Enquiry Society of Ireland, former member of the Economic Committee of the ETUC, a member of the National Competitiveness Council of Ireland, the National Statistics Board, the ESB, TUAC, (advisor to OECD) and several other bodies. He has written three books on the Irish economy and two on public enterprise, including The Celtic Tiger; Ireland’s Economic Miracle Explained and Selling Out: Privatisation in Ireland, chapters in other books and many articles on economics.
Share:
![Duggan, Vic]](/assets/img/2017/04/1491994913319631_sq.jpg)

